0
2
4
6
8
10
12
14
16
0
0.02
0.04
0.06
0.08
0.1
0.12
0.14
0.16
0.18
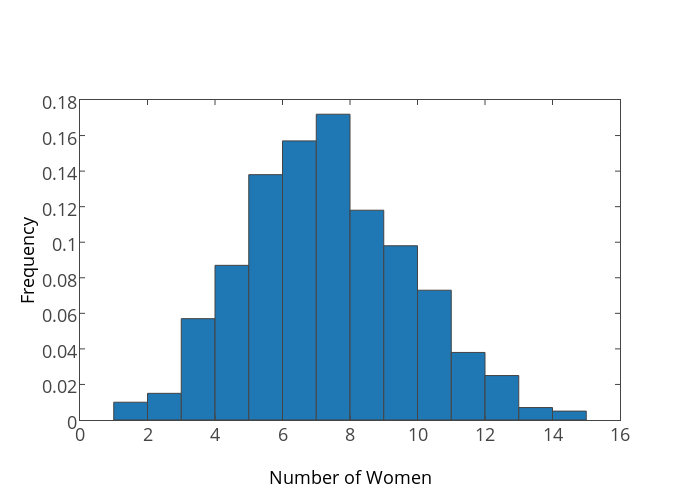
Number of Women
Frequency
plotly-logomark
Edit chart
Rebecca_roisin's interactive graph and data of "Frequency vs Number of Women" is a bar chart, showing trace 0; with Number of Women in the x-axis and Frequency in the y-axis.. The x-axis shows values from 0 to 16. The y-axis shows values from 0 to 0.18.