1960-Q1
1962-Q4
1965-Q3
1968-Q2
1971-Q1
1973-Q4
1976-Q3
1979-Q2
1982-Q1
1984-Q4
1987-Q3
1990-Q2
1993-Q1
1995-Q4
1998-Q3
2001-Q2
2004-Q1
2006-Q4
2009-Q3
2012-Q2
3
4
5
6
7
8
9
10
11
−4
−2
0
2
4
6
8
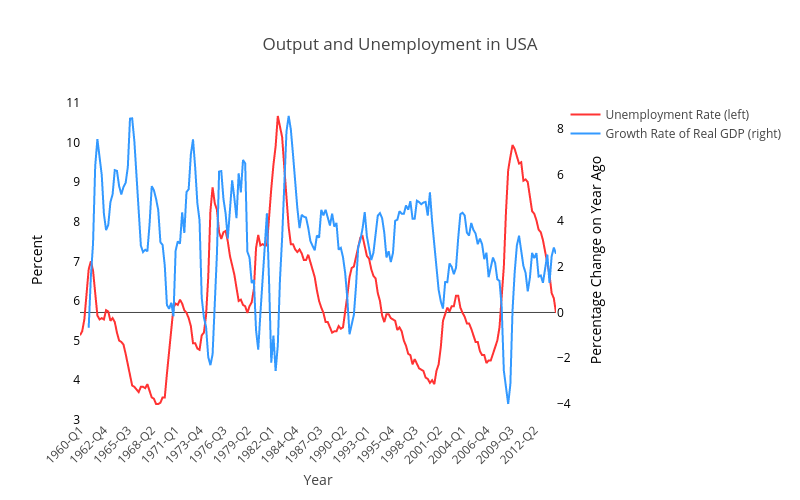
Unemployment Rate (left)
Growth Rate of Real GDP (right)
Output and Unemployment in USA
Year
Percent
Percentage Change on Year Ago
plotly-logomark
Edit chart
Rdkweb's interactive graph and data of "Output and Unemployment in USA" is a scatter chart, showing Unemployment Rate (left) vs Growth Rate of Real GDP (right); with Year in the x-axis and Percent in the y-axis.. The x-axis shows values from 0 to 0. The y-axis shows values from 0 to 0.