2005-Q4
2006-Q2
2006-Q4
2007-Q2
2007-Q4
2008-Q2
2008-Q4
2009-Q2
2009-Q4
2010-Q2
2010-Q4
2011-Q2
2011-Q4
2012-Q2
2012-Q4
2013-Q2
2013-Q4
2014-Q2
2014-Q4
15k
15.5k
16k
16.5k
17k
17.5k
18k
18.5k
19k
Real GDP
Potential Real GDP
2007 Forecast
2008 Forecast
2009 Forecast
2010 Forecast
2011 Forecast
2012 Forecast
2013 Forecast
2014 Forecast
US Potential GDP updates during the Great Recession
Year
Billions of Chained 2012 Dollars
plotly-logomark
Edit chart
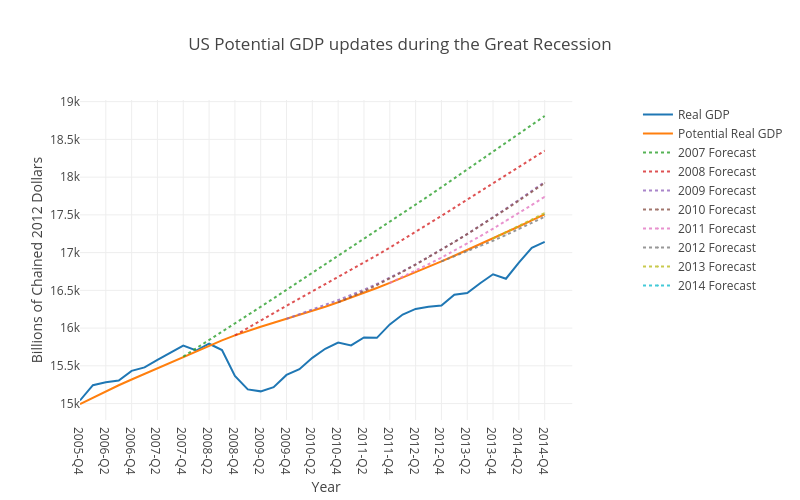
Rdkweb's interactive graph and data of "US Potential GDP updates during the Great Recession" is a scatter chart, showing Real GDP, Potential Real GDP, 2007 Forecast, 2008 Forecast, 2009 Forecast, 2010 Forecast, 2011 Forecast, 2012 Forecast, 2013 Forecast, 2014 Forecast; with Year in the x-axis and Billions of Chained 2012 Dollars in the y-axis.. The x-axis shows values from 0 to 0. The y-axis shows values from 0 to 0.