2006
2008
2010
2012
2014
15k
15.5k
16k
16.5k
17k
Actual GDP
2007 Forecast
2008 Forecast
2009 Forecast
2010 Forecast
2011 Forecast
2012 Forecast
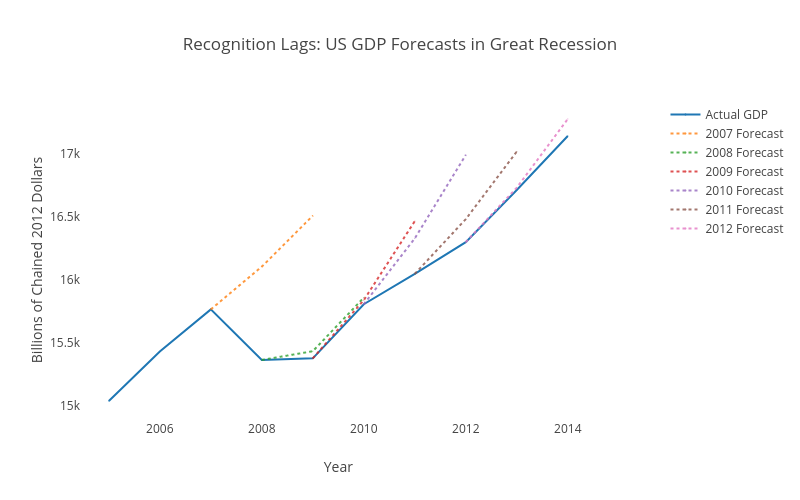
Recognition Lags: US GDP Forecasts in Great Recession
Year
Billions of Chained 2012 Dollars
plotly-logomark
Edit chart
Rdkweb's interactive graph and data of "Recognition Lags: US GDP Forecasts in Great Recession" is a scatter chart, showing Actual GDP, 2007 Forecast, 2008 Forecast, 2009 Forecast, 2010 Forecast, 2011 Forecast, 2012 Forecast; with Year in the x-axis and Billions of Chained 2012 Dollars in the y-axis.. The x-axis shows values from 0 to 0. The y-axis shows values from 0 to 0.