2004
2006
2008
2010
2012
2014
2016
2018
0
1
2
3
4
5
Royaume-Uni
Allemagne
France
Italie
Espagne
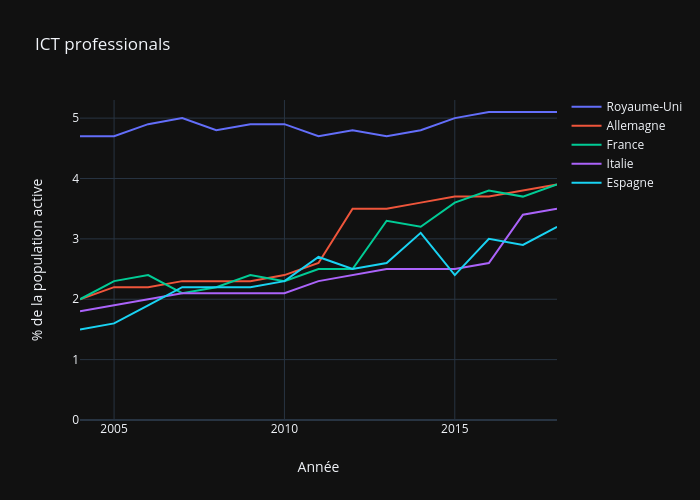
ICT professionals
Année
% de la population active
plotly-logomark
Edit chart
Qchenevier's interactive graph and data of "ICT professionals" is a line chart, showing Royaume-Uni, Allemagne, France, Italie, Espagne; with Année in the x-axis and % de la population active in the y-axis.. The x-axis shows values from 2004 to 2018. The y-axis shows values from 0 to 5.3.