Cambodia
Thailand
Vietnam
0
5
10
15
20
25
Schools
Hospitals
Infrastructure at Risk
plotly-logomark
Edit chart
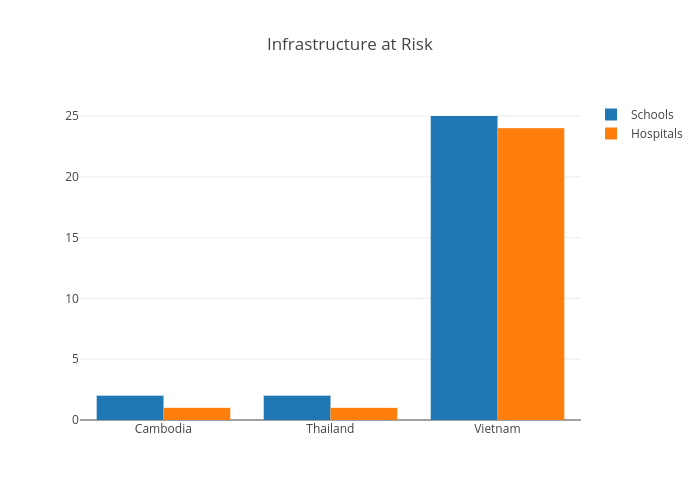
Projectmekongnasa's interactive graph and data of "Infrastructure at Risk" is a grouped bar chart, showing Schools vs Hospitals. The x-axis shows values from 0 to 0. The y-axis shows values from 0 to 0.