Jan 12
2018
Jan 13
Jan 14
Jan 15
Jan 16
Jan 17
0
0.5M
1M
1.5M
2M
2.5M
3M
3.5M
Cambodia
Thailand
Vietnam
Laos
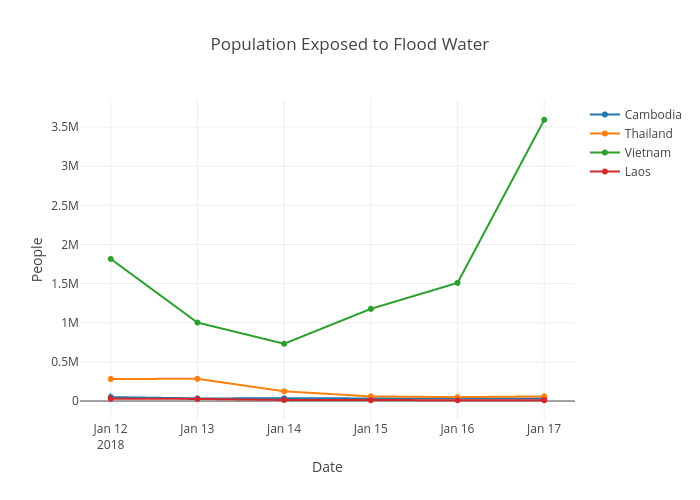
Population Exposed to Flood Water
Date
People
plotly-logomark
Edit chart
Projectmekongnasa's interactive graph and data of "Population Exposed to Flood Water" is a line chart, showing Cambodia, Thailand, Vietnam, Laos; with Date in the x-axis and People in the y-axis.. The x-axis shows values from 0 to 0. The y-axis shows values from 0 to 0.