−1
−0.5
0
0.5
1
−1
−0.5
0
0.5
1
Friction circle for all laps
Lateral g
Long g
Acceleration
Left
Right
Braking
plotly-logomark
Edit chart
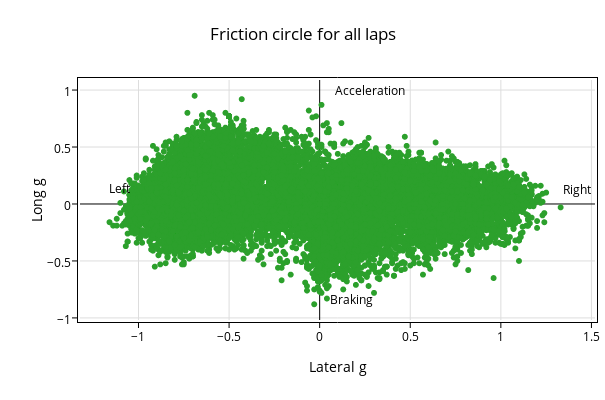
Pfsq's interactive graph and data of "Friction circle for all laps" is a scatter chart, showing LINEALG; with Lateral g in the x-axis and Long g in the y-axis.. The x-axis shows values from -1.3631981355224712 to 1.5331981355224713. The y-axis shows values from -1.0107142857142857 to 1.0807142857142857. This visualization has the following annotations: Acceleration; Left; Right; Braking