2016
2017
2018
2019
2020
2021
62
64
66
68
70
72
74
76
78
New Zealand
Australia
United States
Japan
Germany
France
Korea
United Kingdom
Employment Rate in the Pandemic
Year
Employment Rate (Ages 15-64)
plotly-logomark
Edit chart
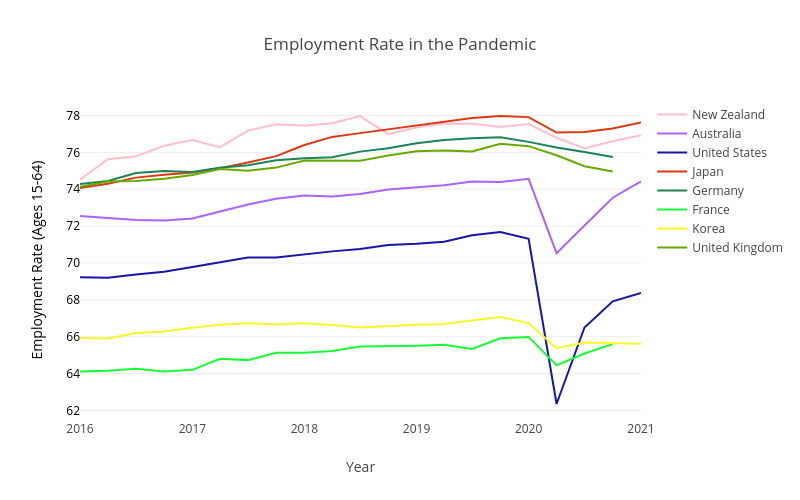
Pandemicrecession's interactive graph and data of "Employment Rate in the Pandemic" is a scatter chart, showing New Zealand, Australia, United States, Japan, Germany, France, Korea, United Kingdom; with Year in the x-axis and Employment Rate (Ages 15-64) in the y-axis.. The x-axis shows values from 0 to 0. The y-axis shows values from 0 to 0.