0
0.2
0.4
0.6
0.8
1
1.2
1.4
1.6
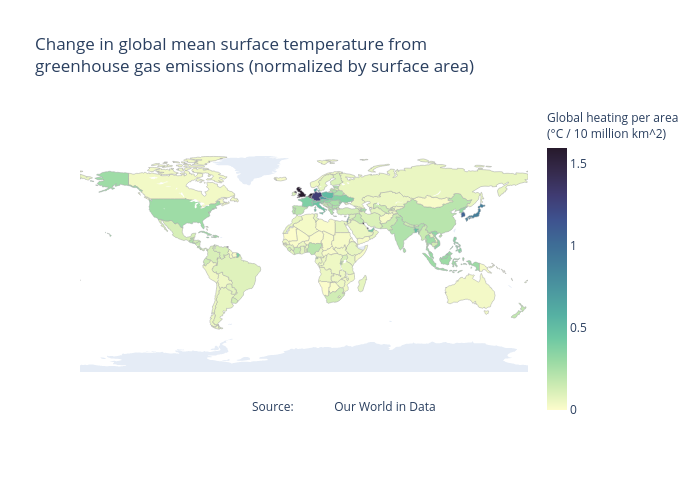
Global heating per area
(°C / 10 million km^2)
Change in global mean surface temperature from
greenhouse gas emissions (normalized by surface area)
Source:
Our World in Data
plotly-logomark
Edit chart
Loading graph
Osemonin's interactive graph and data of "Change in global mean surface temperature fromgreenhouse gas emissions (normalized by surface area)" is a choropleth. The x-axis shows values from 0 to 0. The y-axis shows values from 0 to 0. This visualization has the following annotation: Source: Our World in Data