2
4
6
8
10
0
5
10
15
20
25
A93
DSLR
Year-2003
Saved Photos (GB)
plotly-logomark
Edit chart
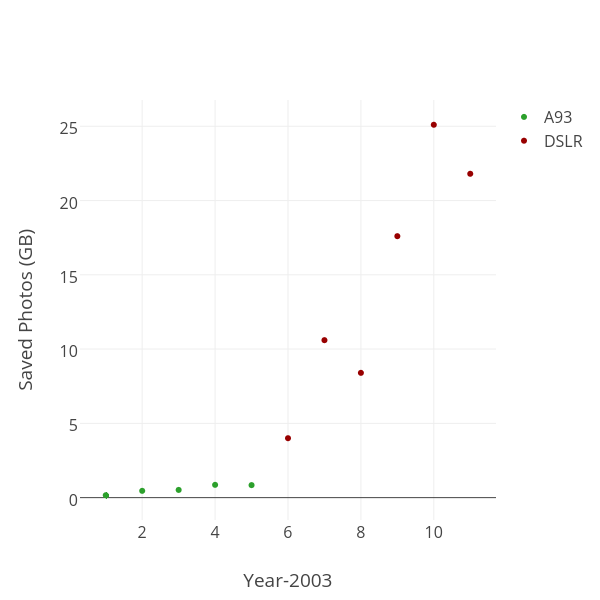
Orzelc's interactive graph and data of "Saved Photos (GB) vs Year-2003" is a scatter chart, showing A93 vs DSLR; with Year-2003 in the x-axis and Saved Photos (GB) in the y-axis.. The x-axis shows values from 0.3308803488689015 to 11.669119651131098. The y-axis shows values from -1.5057123481781378 to 26.76601234817814.