60
80
100
-50
-25
0
25
50
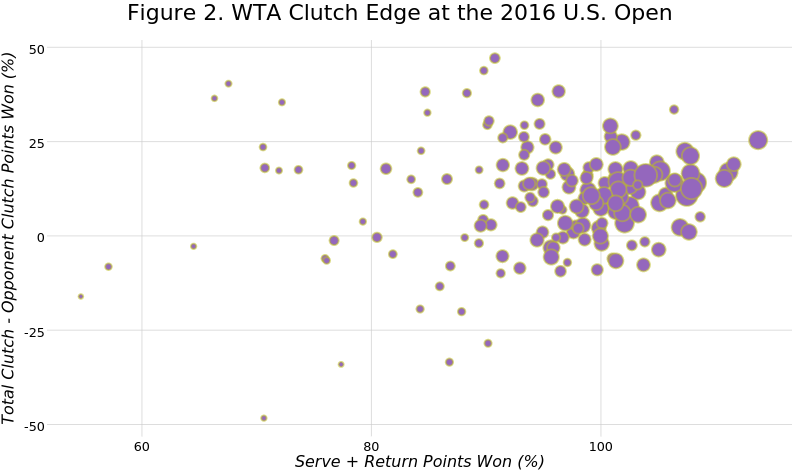
Figure 2. WTA Clutch Edge at the 2016 U.S. Open
Serve + Return Points Won (%)
Total Clutch - Opponent Clutch Points Won (%)
n
plotly-logomark
Edit chart
On-the-t's interactive graph and data of "Figure 2. WTA Clutch Edge at the 2016 U.S. Open" is a scatter chart. The x-axis shows values from 51.7272972776286 to 116.650733777987. The y-axis shows values from -53.0943172433301 to 51.8957613290907. This visualization has the following annotations: Serve + Return Points Won (%) ; Total Clutch - Opponent Clutch Points Won (%) ; n