-10
0
10
20
20
30
40
50
60
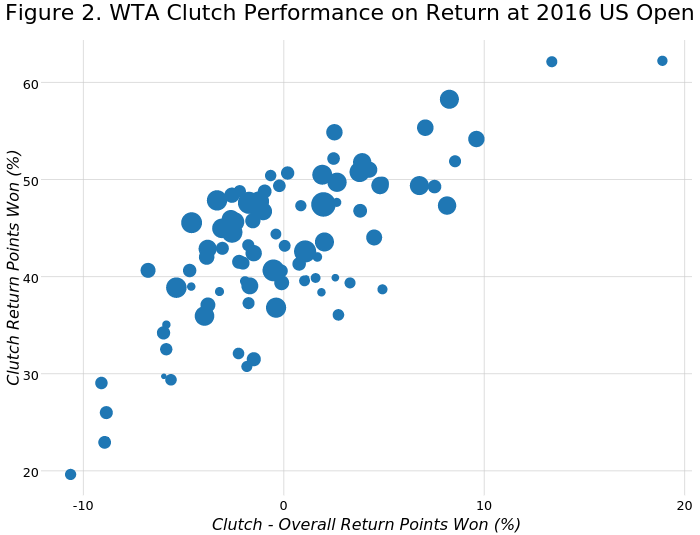
Figure 2. WTA Clutch Performance on Return at 2016 US Open
Clutch - Overall Return Points Won (%)
Clutch Return Points Won (%)
plotly-logomark
Edit chart
On-the-t's interactive graph and data of "Figure 2. WTA Clutch Performance on Return at 2016 US Open" is a scatter chart. The x-axis shows values from -12.1139204570063 to 20.3671011920276. The y-axis shows values from 17.4957286658007 to 64.3539432972908. This visualization has the following annotations: Clutch - Overall Return Points Won (%) ; Clutch Return Points Won (%)