-10
0
10
20
30
40
50
60
70
80
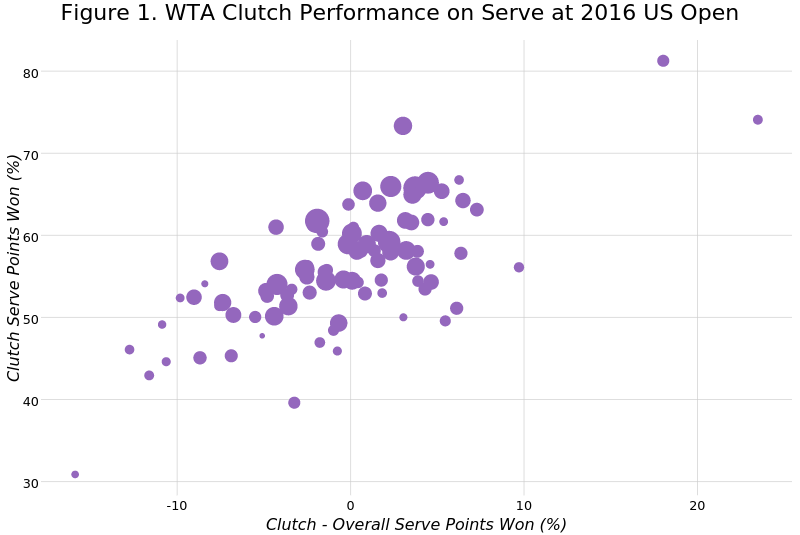
Figure 1. WTA Clutch Performance on Serve at 2016 US Open
Clutch - Overall Serve Points Won (%)
Clutch Serve Points Won (%)
plotly-logomark
Edit chart
On-the-t's interactive graph and data of "Figure 1. WTA Clutch Performance on Serve at 2016 US Open" is a scatter chart. The x-axis shows values from -17.8508534809703 to 25.4496831676122. The y-axis shows values from 28.3510068283788 to 83.7820452427099. This visualization has the following annotations: Clutch - Overall Serve Points Won (%) ; Clutch Serve Points Won (%)