1 or more
2 or more
3 or more
4 or more
78
80
82
84
Control
Missed Chance
Broke Service
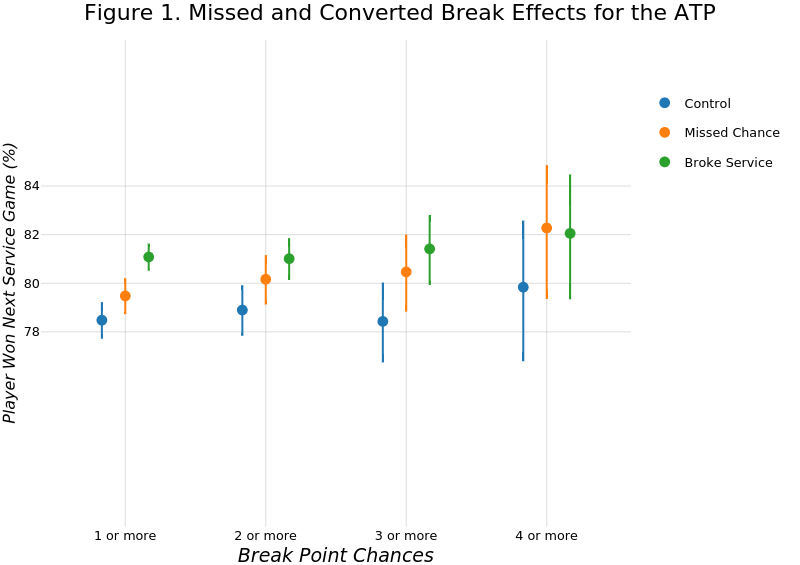
Figure 1. Missed and Converted Break Effects for the ATP
Break Point Chances
Player Won Next Service Game (%)
plotly-logomark
Edit chart
On-the-t's interactive graph and data of "Figure 1. Missed and Converted Break Effects for the ATP" is a with vertical error bars, showing Control, Missed Chance, Broke Service; with Break Point Chances in the x-axis. The x-axis shows values from 0.4 to 4.6. The y-axis shows values from 70 to 90. This visualization has the following annotation: Player Won Next Service Game (%)