-22
-20
-18
-16
-14
-12
-10
-8
-6
-4
-2
0
2
4
6
8
10
12
14
16
18
20
22
0
40
80
ATP
WTA
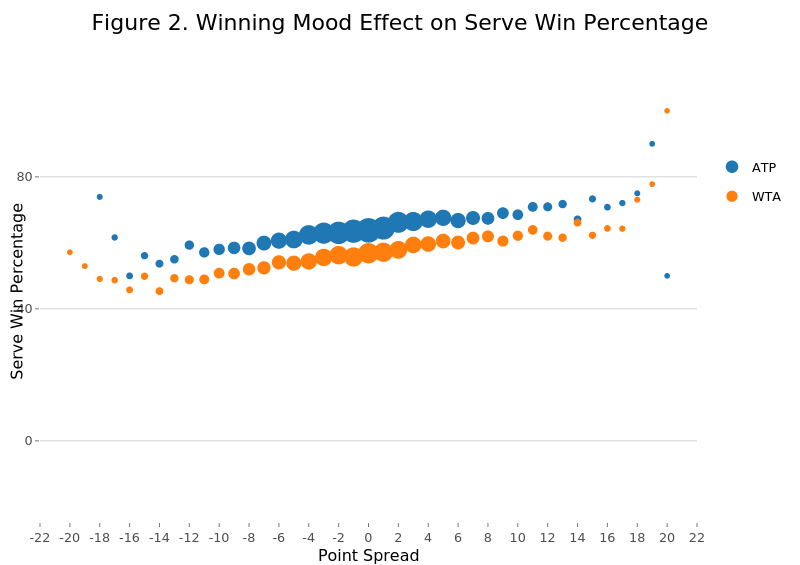
Figure 2. Winning Mood Effect on Serve Win Percentage
Point Spread
Serve Win Percentage
plotly-logomark
Edit chart
On-the-t's interactive graph and data of "Figure 2. Winning Mood Effect on Serve Win Percentage" is a scatter chart, showing ATP vs WTA. The x-axis shows values from -22 to 22. The y-axis shows values from -24.6650169967335 to 115.337412768522. This visualization has the following annotations: Point Spread; Serve Win Percentage