0
25
50
75
100
0
25
50
75
100
0
25
50
75
100
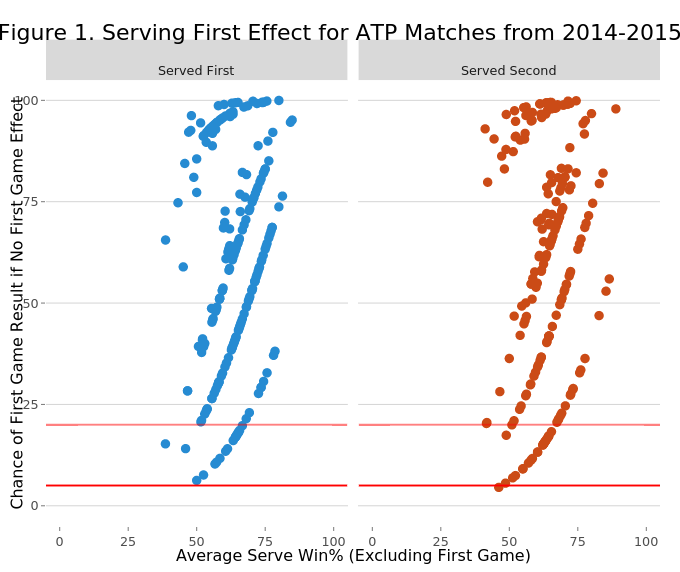
Figure 1. Serving First Effect for ATP Matches from 2014-2015
Average Serve Win% (Excluding First Game)
Chance of First Game Result if No First Game Effect
Served First
Served Second
plotly-logomark
Edit chart
On-the-t's interactive graph and data of "Figure 1. Serving First Effect for ATP Matches from 2014-2015" is a scatter chart, showing Served First, Served Second, , , , . The x-axis shows values from -5 to 105. The y-axis shows values from -5 to 105. This visualization has the following annotations: Average Serve Win% (Excluding First Game); Chance of First Game Result if No First Game Effect; Served First; Served Second