-50
-25
0
25
50
-20
0
20
90-96
97-98
99-100
101-103
104-120
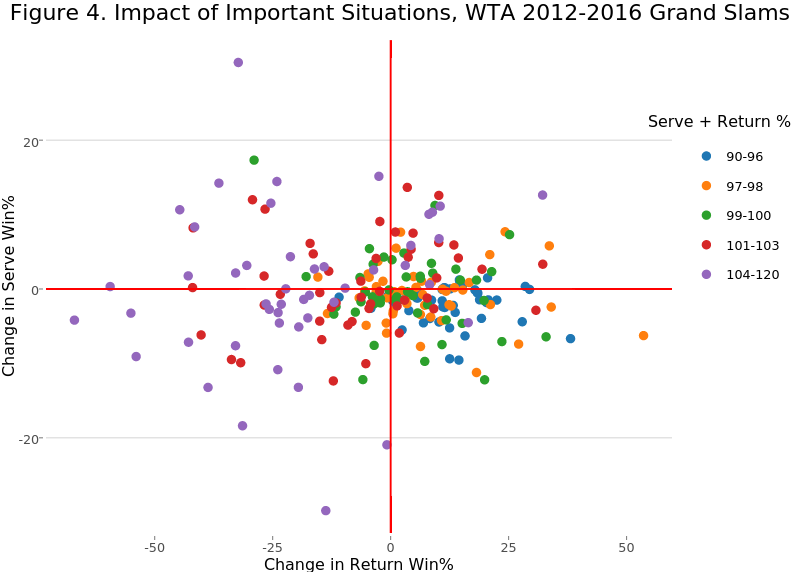
Figure 4. Impact of Important Situations, WTA 2012-2016 Grand Slams
Change in Return Win%
Change in Serve Win%
Serve + Return %
plotly-logomark
Edit chart
On-the-t's interactive graph and data of "Figure 4. Impact of Important Situations, WTA 2012-2016 Grand Slams" is a scatter chart, showing 90-96, 97-98, 99-100, 101-103, 104-120, , . The x-axis shows values from -73.0388451633897 to 59.6207817669374. The y-axis shows values from -32.7989543837504 to 33.4509173043369. This visualization has the following annotations: Change in Return Win%; Change in Serve Win%; Serve + Return %