95
100
105
110
-0.015
-0.010
-0.005
0.000
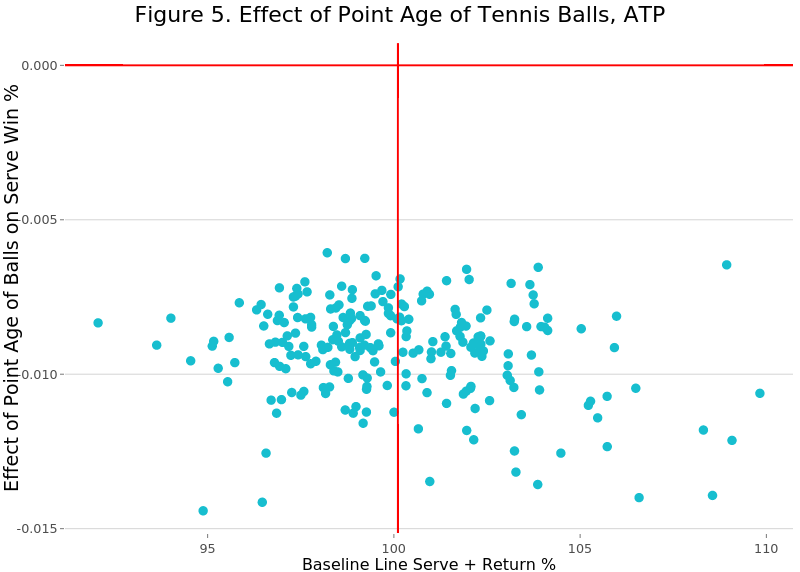
Figure 5. Effect of Point Age of Tennis Balls, ATP
Effect of Point Age of Balls on Serve Win %
Baseline Line Serve + Return %
plotly-logomark
Edit chart
On-the-t's interactive graph and data of "Figure 5. Effect of Point Age of Tennis Balls, ATP" is a scatter chart, showing , , ; with Effect of Point Age of Balls on Serve Win % in the y-axis. The x-axis shows values from 91.1708997935048 to 110.714839954726. The y-axis shows values from -0.0151428848308569 to 0.000721089753850327. This visualization has the following annotation: Baseline Line Serve + Return %