90
95
100
105
110
-0.2
-0.1
0.0
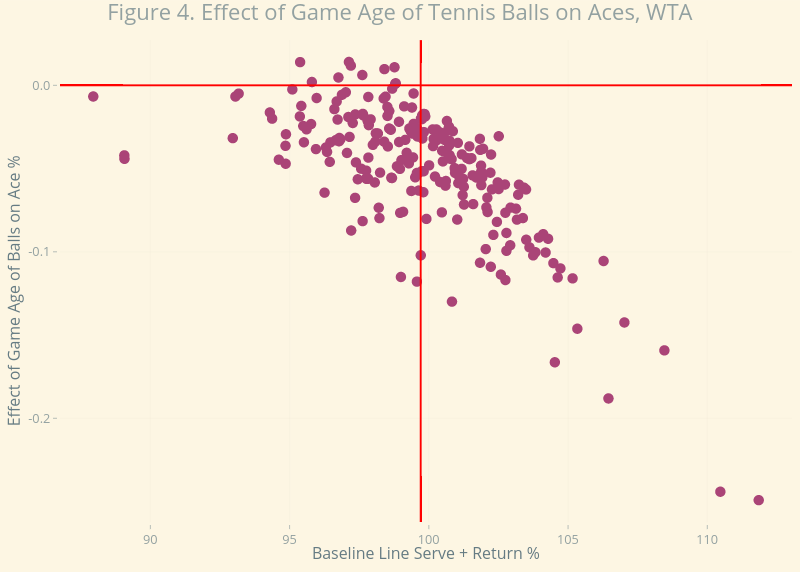
Figure 4. Effect of Game Age of Tennis Balls on Aces, WTA
Baseline Line Serve + Return %
Effect of Game Age of Balls on Ace %
plotly-logomark
Edit chart
On-the-t's interactive graph and data of "Figure 4. Effect of Game Age of Tennis Balls on Aces, WTA" is a scatter chart, showing , , . The x-axis shows values from 86.7550826250123 to 113.041531629618. The y-axis shows values from -0.262337529449455 to 0.0271851551859236. This visualization has the following annotations: Baseline Line Serve + Return %; Effect of Game Age of Balls on Ace %