-15
-14
-13
-12
-11
-10
-9
-8
-7
-6
-5
-4
-3
-2
-1
0
1
2
3
4
5
6
7
8
9
10
11
12
13
14
15
-7
-6
-5
-4
-3
-2
-1
0
1
2
3
4
5
6
7
8
9
10
11
12
13
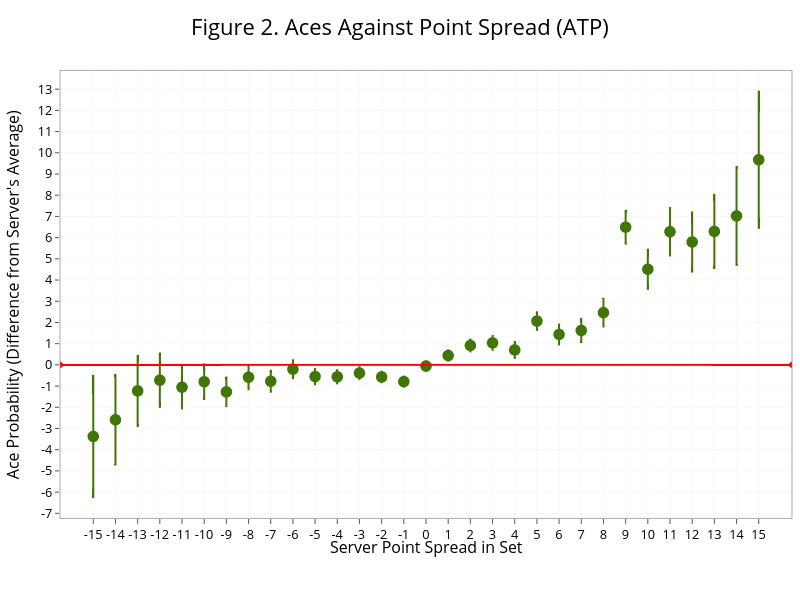
Figure 2. Aces Against Point Spread (ATP)
Server Point Spread in Set
Ace Probability (Difference from Server's Average)
plotly-logomark
Edit chart
On-the-t's interactive graph and data of "Figure 2. Aces Against Point Spread (ATP)" is a with vertical error bars, showing vs . The x-axis shows values from -16.5 to 16.5. The y-axis shows values from -7.23891076749576 to 13.8834853966556. This visualization has the following annotations: Server Point Spread in Set; Ace Probability (Difference from Server's Average)