55
60
65
70
55
60
65
70
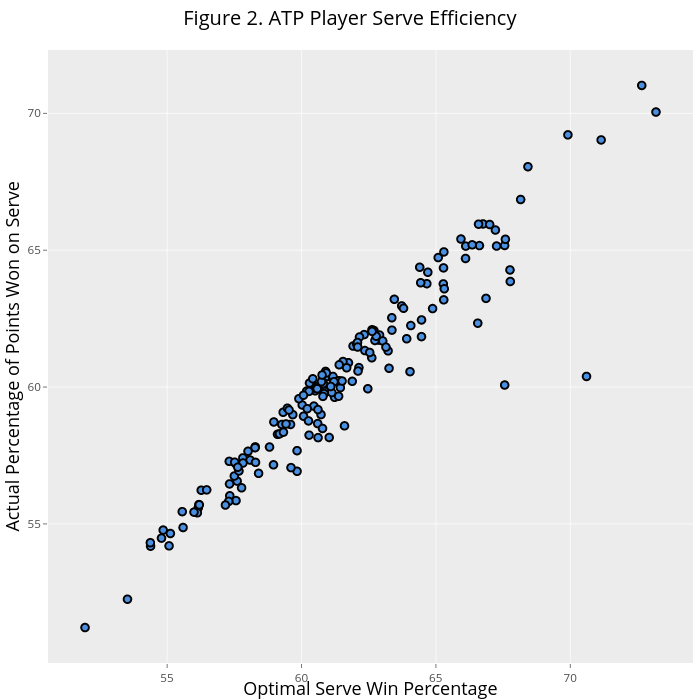
Figure 2. ATP Player Serve Efficiency
Optimal Serve Win Percentage
Actual Percentage of Points Won on Serve
plotly-logomark
Edit chart
On-the-t's interactive graph and data of "Figure 2. ATP Player Serve Efficiency" is a scatter chart, showing vs ; with Optimal Serve Win Percentage in the x-axis and Actual Percentage of Points Won on Serve in the y-axis.. The x-axis shows values from 50.56638116094177 to 74.56509143566602. The y-axis shows values from 49.91730644524668 to 72.31559349083594.