2004
2006
2008
2010
2012
2014
2016
60
120
180
240
300
Semifinal
Final
Semifinal - fit
Final - fit
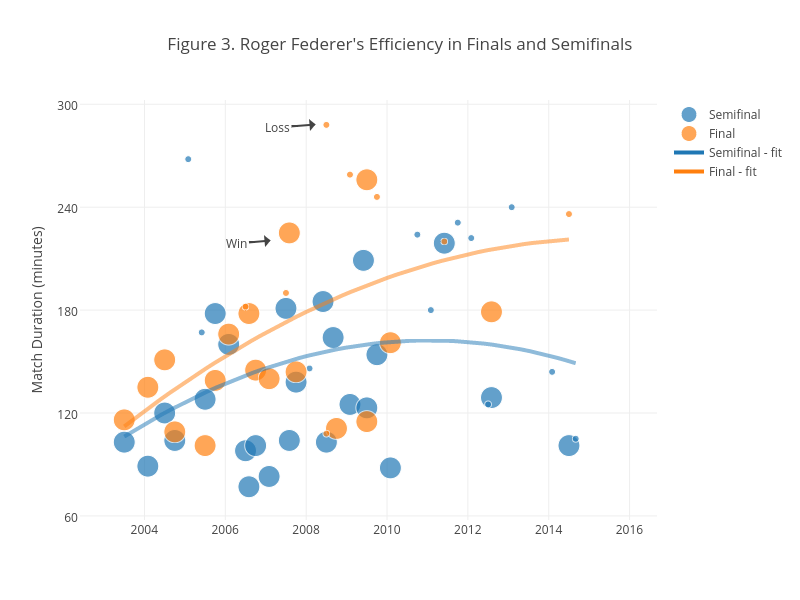
Figure 3. Roger Federer's Efficiency in Finals and Semifinals
Match Duration (minutes)
Loss
Win
plotly-logomark
Edit chart
On-the-t's interactive graph and data of "Figure 3. Roger Federer's Efficiency in Finals and Semifinals" is a scatter chart, showing Semifinal, Final, Semifinal - fit, Final - fit; with Match Duration (minutes) in the y-axis. The x-axis shows values from 2002.4963842947896 to 2016.5869490385405. The y-axis shows values from 57.61451294812596 to 302.5026134410598. This visualization has the following annotations: Loss; Win