2000
2005
2010
2015
2020
0
50k
100k
150k
200k
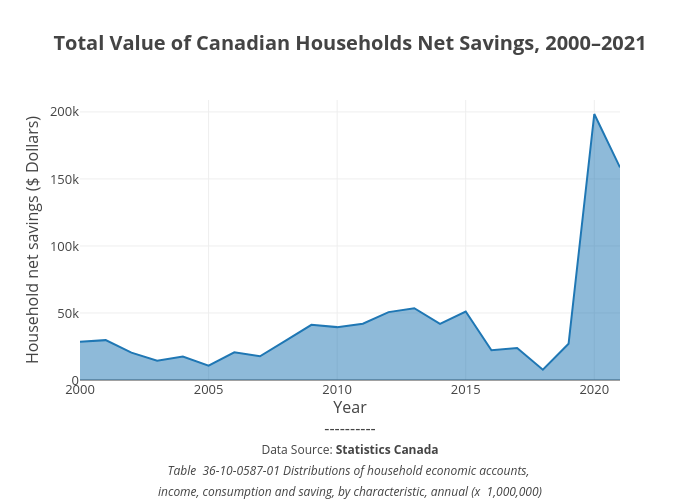
Total Value of Canadian Households Net Savings, 2000–2021
Year
----------
Data Source:
Statistics Canada
Table 36-10-0587-01 Distributions of household economic accounts,
income, consumption and saving, by characteristic, annual (x 1,000,000)
Household net savings ($ Dollars)
plotly-logomark
Edit chart
Oerdesignstudio's interactive graph and data of "Total Value of Canadian Households Net Savings, 2000–2021" is a line chart; with Year----------Data Source: Statistics CanadaTable 36-10-0587-01 Distributions of household economic accounts, income, consumption and saving, by characteristic, annual (x 1,000,000) in the x-axis and Household net savings ($ Dollars) in the y-axis.. The x-axis shows values from 2000 to 2021. The y-axis shows values from 0 to 208908.42105263157.