−74.2
−74.1
−74
−73.9
−73.8
−73.7
40.5
40.55
40.6
40.65
40.7
40.75
40.8
40.85
40.9
10
20
30
40
50
60
70
80
90
100
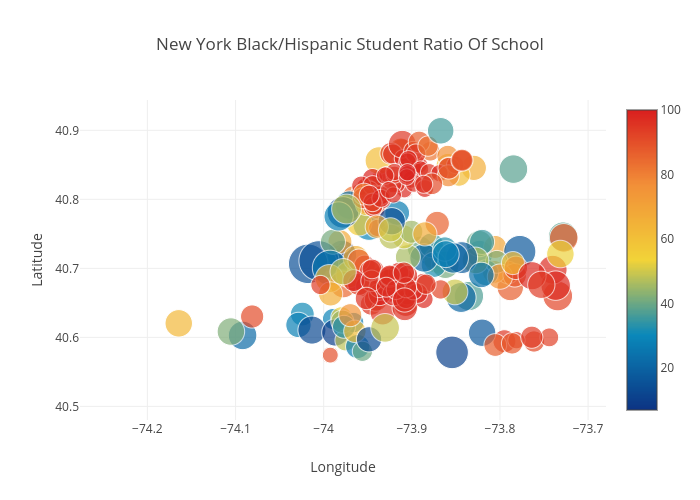
New York Black/Hispanic Student Ratio Of School
Longitude
Latitude
plotly-logomark
Edit chart
Obaig47's interactive graph and data of "New York Black/Hispanic Student Ratio Of School" is a scatter chart, showing y; with Longitude in the x-axis and Latitude in the y-axis.. The x-axis shows values from -74.27532180758868 to -73.6809211924113. The y-axis shows values from 40.48065231302974 to 40.942417113870576.