−74.2
−74.1
−74
−73.9
−73.8
−73.7
40.5
40.55
40.6
40.65
40.7
40.75
40.8
40.85
40.9
0.1
0.2
0.3
0.4
0.5
0.6
0.7
0.8
0.9
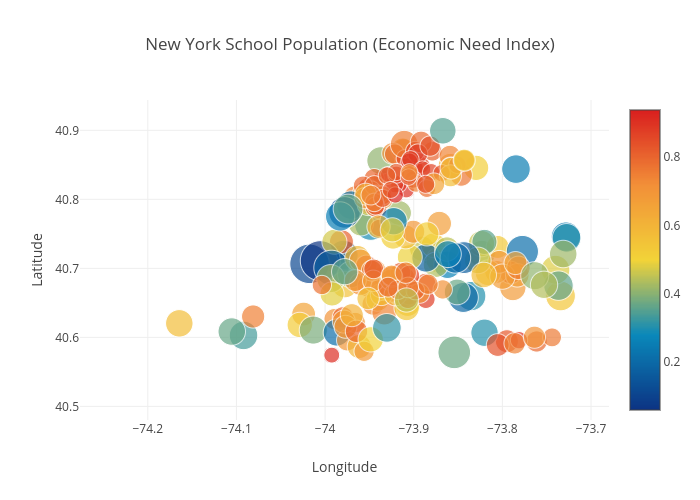
New York School Population (Economic Need Index)
Longitude
Latitude
plotly-logomark
Edit chart
Obaig47's interactive graph and data of "New York School Population (Economic Need Index)" is a scatter chart, showing y; with Longitude in the x-axis and Latitude in the y-axis.. The x-axis shows values from -74.27530762996872 to -73.68093537003126. The y-axis shows values from 40.48065231302974 to 40.942417113870576.