1984Q4
1985Q2
1985Q4
1986Q2
1986Q4
1987Q2
1987Q4
1988Q2
1988Q4
1989Q2
1989Q4
1990Q2
1990Q4
1991Q2
1991Q4
1992Q2
1992Q4
1993Q2
1993Q4
1994Q2
1994Q4
1995Q2
1995Q4
1996Q2
1996Q4
1997Q2
1997Q4
1998Q2
1998Q4
1999Q2
1999Q4
2000Q2
2000Q4
2001Q2
2001Q4
2002Q2
2002Q4
2003Q2
2003Q4
2004Q2
2004Q4
2005Q2
2005Q4
2006Q2
2006Q4
2007Q2
2007Q4
2008Q2
2008Q4
2009Q2
2009Q4
2010Q2
2010Q4
2011Q2
2011Q4
2012Q2
2012Q4
2013Q2
2013Q4
100k
200k
300k
400k
500k
600k
Land Value
Structure Cost
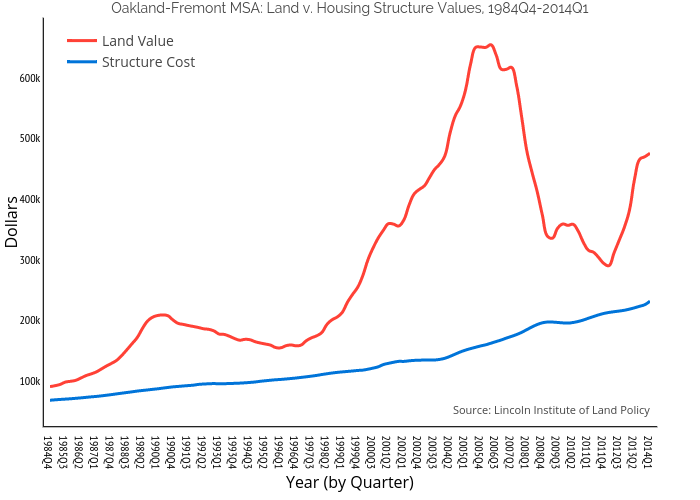
Oakland-Fremont MSA: Land v. Housing Structure Values, 1984Q4-2014Q1
Year (by Quarter)
Dollars
Source: Lincoln Institute of Land Policy
plotly-logomark
Edit chart
Oakclt's interactive graph and data of "Oakland-Fremont MSA: Land v. Housing Structure Values, 1984Q4-2014Q1" is a line chart, showing Structure Cost vs Land Value; with Year (by Quarter) in the x-axis and Dollars in the y-axis.. The x-axis shows values from 0 to 117. The y-axis shows values from 32614.72222222222 to 683340.2777777778. This visualization has the following annotation: Source: Lincoln Institute of Land Policy