1970 - 1977
1977 - 1987
1987 - 1997
1997 - 2007
2007 - 2017
0%
5%
10%
15%
20%
25%
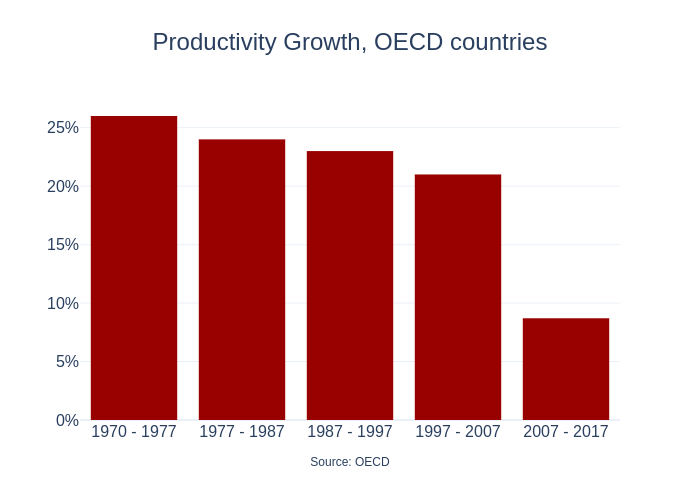
Productivity Growth, OECD countries
Source: OECD
plotly-logomark
Edit chart
Niklasalbin's interactive graph and data of "Productivity Growth, OECD countries" is a bar chart; with Source: OECD in the x-axis. The x-axis shows values from -0.5 to 4.5. The y-axis shows values from 0 to 27.36842105263158.