Network graph made with Python
Python code:
https://plot.ly/ipython-notebooks/network-graphs/
plotly-logomark
Edit chart
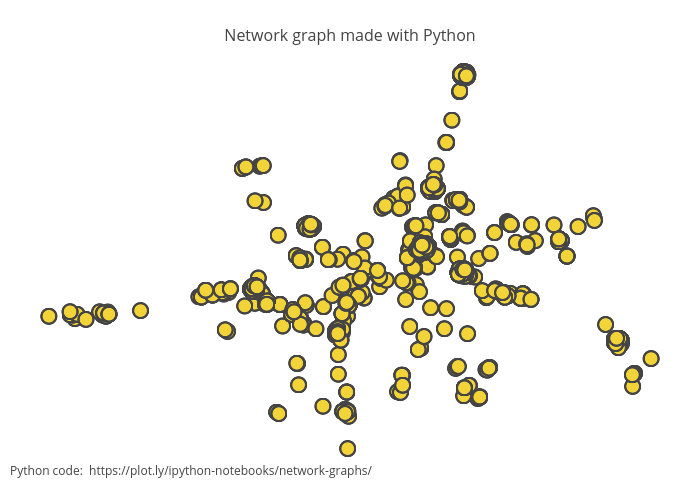
Nicoreno's interactive graph and data of "Network graph made with Python" is a scattergl. The x-axis shows values from 0 to 0. The y-axis shows values from 0 to 0. This visualization has the following annotation: Python code: https://plot.ly/ipython-notebooks/network-graphs/