H
R
AB
RBI
G
BB
SO
2B
SH
HR
GIDP
SB
IBB
CS
HBP
3B
SF
0
0.02
0.04
0.06
0.08
0.1
0.12
0.14
Feature Importance
Features
Rate
plotly-logomark
Edit chart
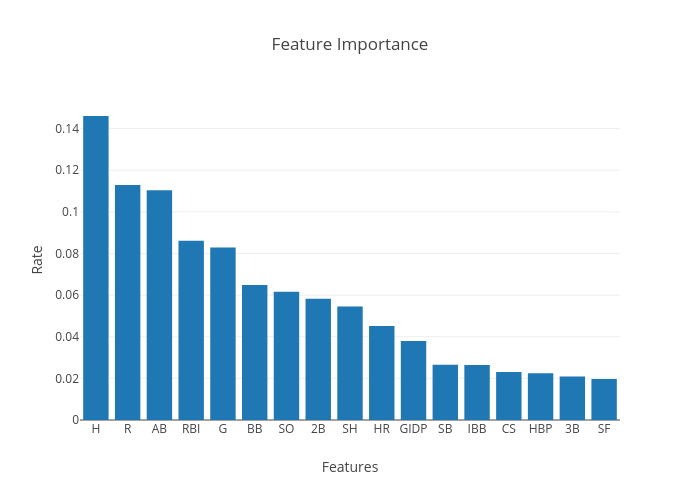
Nicole.semerano's interactive graph and data of "Feature Importance" is a bar chart; with Features in the x-axis and Rate in the y-axis.. The x-axis shows values from -0.5 to 16.5. The y-axis shows values from 0 to 0.1537533157722303.