10
15
20
25
30
35
2
3
4
5
4
5
6
7
8
cyl
New x label
wt
plotly-logomark
Edit chart
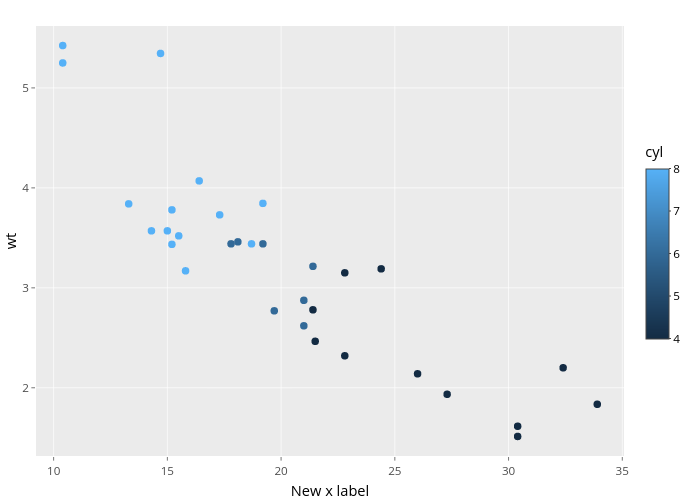
Nadhil's interactive graph and data of "wt vs New x label" is a scatter chart, showing 99_531d9fbdcf7888a300c767b09a2d0955; with New x label in the x-axis and wt in the y-axis.. The x-axis shows values from 9.225 to 35.075. The y-axis shows values from 1.31745 to 5.61955.