1975
1980
1985
1990
1995
2000
2005
2010
0%
10%
20%
30%
40%
50%
60%
Protestant
Roman Catholic
Jewish
Other
None
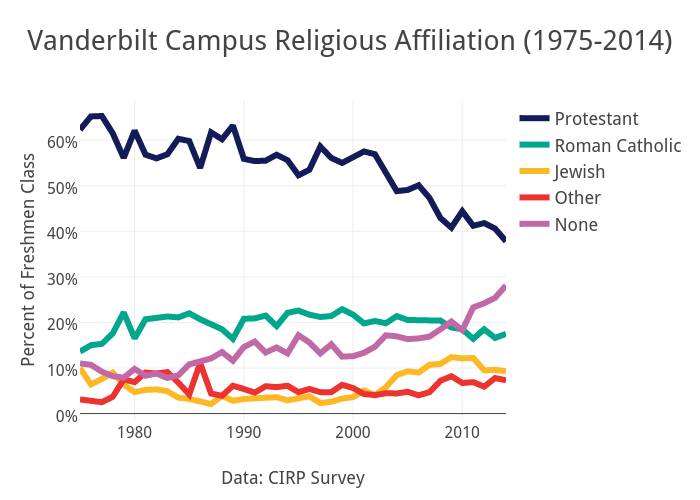
Vanderbilt Campus Religious Affiliation (1975-2014)
Data: CIRP Survey
Percent of Freshmen Class
plotly-logomark
Edit chart
Mzoorob's interactive graph and data of "Vanderbilt Campus Religious Affiliation (1975-2014)" is a scatter chart, showing Protestant, Roman Catholic, Jewish, Other, None; with Data: CIRP Survey in the x-axis and Percent of Freshmen Class in the y-axis.. The x-axis shows values from 1975 to 2014. The y-axis shows values from -1.41111111111111 to 68.8111111111111.