1912
1915
1918
1921
1924
1927
1930
1933
1936
1939
1942
1945
1948
1951
1954
1957
1960
1963
1966
1969
1972
1975
1978
1981
1984
1987
1990
1993
1996
1999
2002
0
50
100
150
200
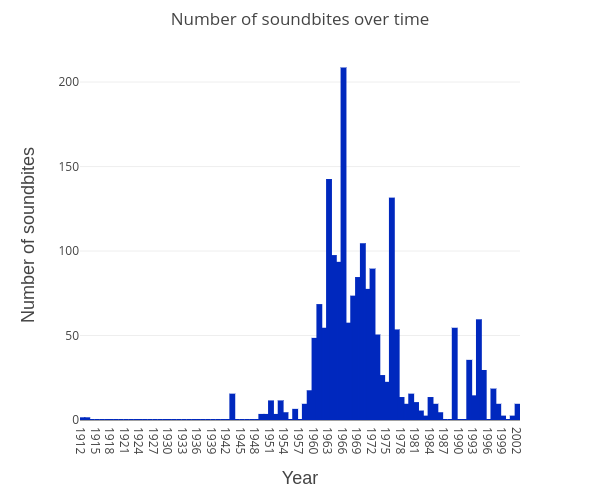
Number of soundbites over time
Year
Number of soundbites
plotly-logomark
Edit chart
Mwigham's interactive graph and data of "Number of soundbites over time" is a bar chart; with Year in the x-axis and Number of soundbites in the y-axis.. The x-axis shows values from 0 to 0. The y-axis shows values from 0 to 0.