1815
1821
1827
1833
1839
1845
1851
1857
1863
1869
1875
1881
1887
1893
1899
1905
1911
1917
1923
1929
1935
1941
1947
1953
1959
1965
1971
1977
1983
0
20
40
60
80
100
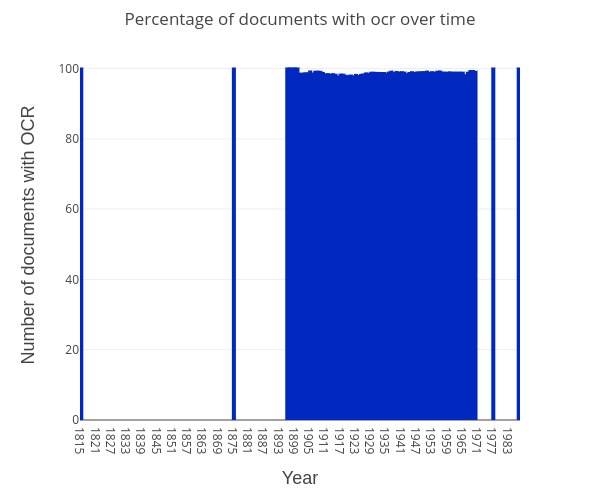
Percentage of documents with ocr over time
Year
Number of documents with OCR
plotly-logomark
Edit chart
Mwigham's interactive graph and data of "Percentage of documents with ocr over time" is a bar chart; with Year in the x-axis and Number of documents with OCR in the y-axis.. The x-axis shows values from 0 to 0. The y-axis shows values from 0 to 0.