1900
1904
1908
1912
1916
1920
1924
1928
1932
1936
1940
1944
1948
1952
1956
1960
1964
1968
1972
1976
1980
1984
1988
1992
0
50
100
150
200
250
300
350
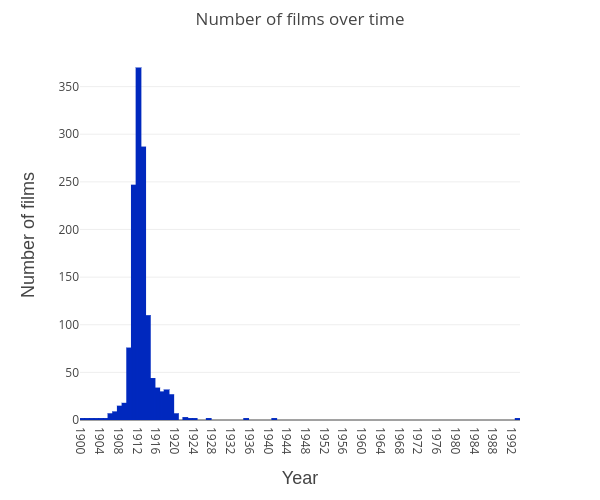
Number of films over time
Year
Number of films
plotly-logomark
Edit chart
Mwigham's interactive graph and data of "Number of films over time" is a bar chart; with Year in the x-axis and Number of films in the y-axis.. The x-axis shows values from 0 to 0. The y-axis shows values from 0 to 0.