Feb 2023
Mar 2023
Apr 2023
May 2023
Jun 2023
Jul 2023
Aug 2023
−60
−40
−20
0
20
40
60
CCO.TO
DML.TO
EU.V
FSY.TO
GLO.TO
GXU.V
NXE.TO
URE.TO
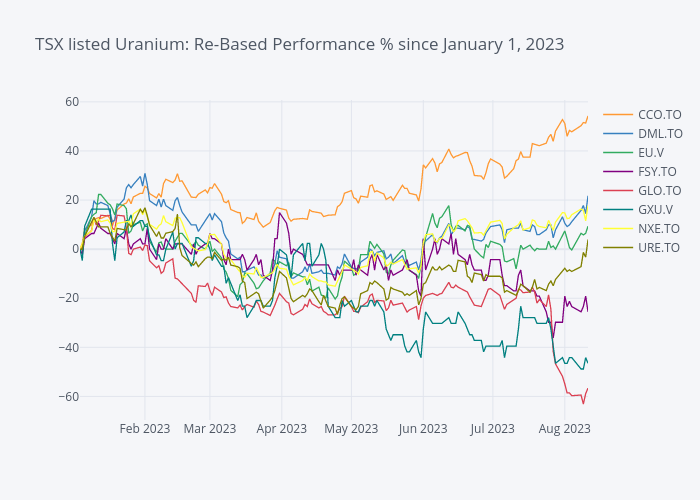
TSX listed Uranium: Re-Based Performance % since January 1, 2023
plotly-logomark
Edit chart
Mwichterle's interactive graph and data of "TSX listed Uranium: Re-Based Performance % since January 1, 2023" is a line chart, showing CCO.TO, DML.TO, EU.V, FSY.TO, GLO.TO, GXU.V, NXE.TO, URE.TO. The x-axis shows values from 2023-01-04 to 2023-08-11. The y-axis shows values from -69.6180594523383 to 60.77127628485216.