Date
2001_07
2001_10
2002_01
2002_04
2002_07
2002_10
2003_01
2003_04
2003_07
2003_10
2004_01
2004_04
2004_07
2004_10
2005_01
2005_04
2005_07
2005_10
2006_01
2006_04
2006_07
2006_10
2007_01
2007_04
2007_07
2007_10
2008_01
2008_04
2008_07
2008_10
2009_01
2009_04
2009_07
2009_10
2010_01
2010_04
2010_07
2010_10
2011_01
2011_04
2011_07
2011_10
2012_01
2012_04
2012_07
2012_10
2013_01
2013_04
2013_07
2013_10
2014_01
2014_04
0
200
400
600
800
1000
Release
IRC posts (divided by 1000)
Haiku General ML posts
Haiku Dev ML posts
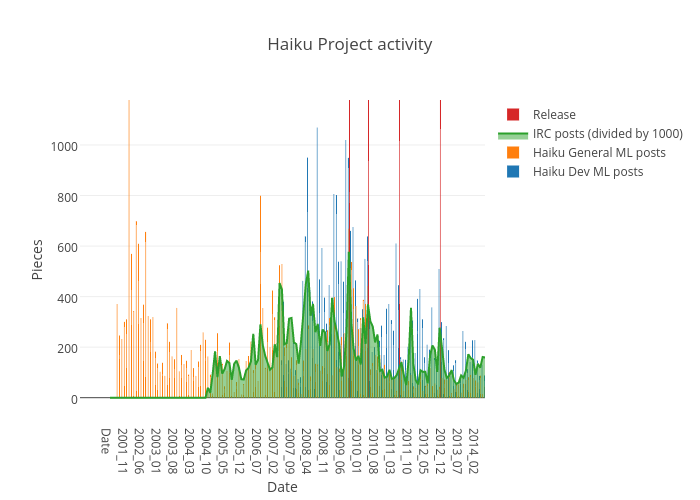
Haiku Project activity
Date
Pieces
plotly-logomark
Edit chart
Miqlas's interactive graph and data of "Haiku Project activity" is a bar chart, showing Haiku Dev ML posts, Haiku General ML posts, IRC posts (divided by 1000), Release; with Date in the x-axis and Pieces in the y-axis.. The x-axis shows values from -11.52099101956395 to 157.97900898043554. The y-axis shows values from -88.33993338079665 to 1177.9758560928842.