0
0.2
0.4
0.6
0.8
1
0
50
100
150
200
250
300
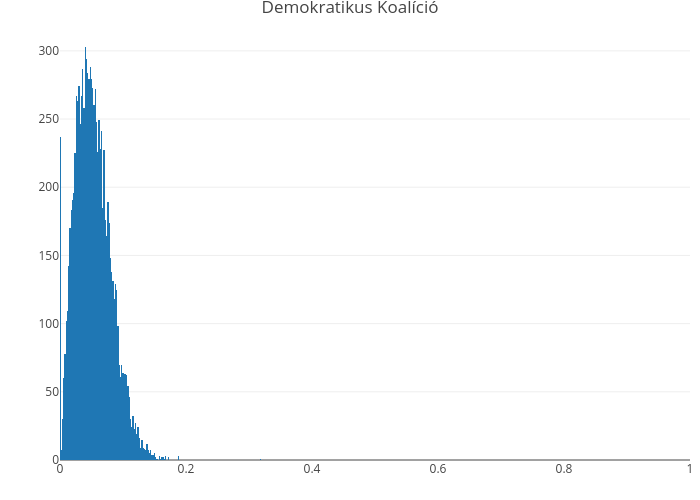
Demokratikus Koalíció
plotly-logomark
Edit chart
Miklos.hajdu's interactive graph and data of "Demokratikus Koalíció" is a histogram. The x-axis shows values from 0 to 1. The y-axis shows values from 0 to 318.94736842105266.