Feb 2022
Mar 2022
Apr 2022
May 2022
Jun 2022
Jul 2022
$80.0
$90.0
$100.0
$110.0
$120.0
$130.0
$140.0
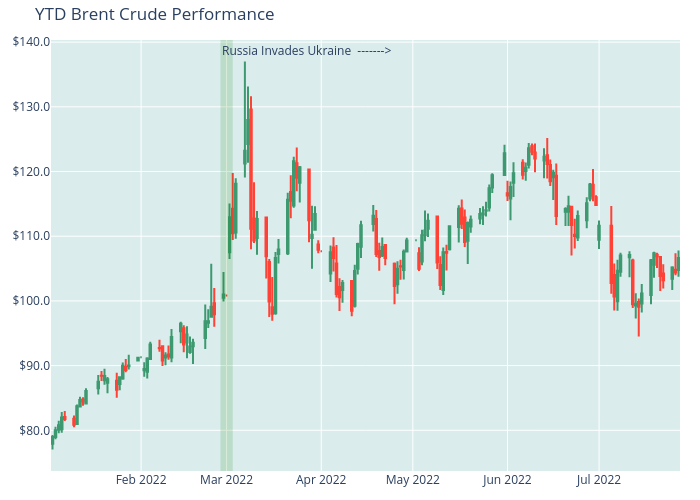
YTD Brent Crude Performance
Russia Invades Ukraine ------->
plotly-logomark
Edit chart
Michaelwichterle1's interactive graph and data of "YTD Brent Crude Performance" is a candlestick. The x-axis shows values from 0 to 0. The y-axis shows values from 0 to 0. This visualization has the following annotation: Russia Invades Ukraine ------->