Mar 2021
May 2021
Jul 2021
Sep 2021
Nov 2021
Jan 2022
Mar 2022
May 2022
Jul 2022
50%
100%
150%
200%
250%
300%
350%
Stock Ticker
NYMEX Natural Gas
Brent Crude
WTI
Gold
Palladium
Copper
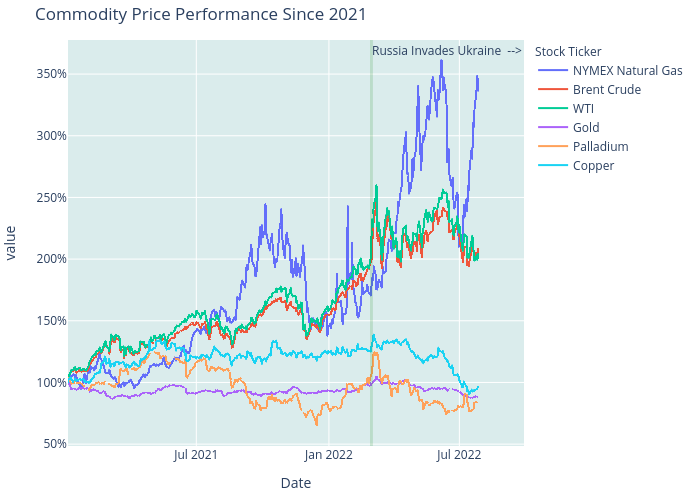
Commodity Price Performance Since 2021
Date
value
Russia Invades Ukraine -->
plotly-logomark
Edit chart
Michaelwichterle1's interactive graph and data of "Commodity Price Performance Since 2021" is a scattergl, showing NYMEX Natural Gas, Brent Crude, WTI, Gold, Palladium, Copper; with Date in the x-axis and value in the y-axis.. The x-axis shows values from 0 to 0. The y-axis shows values from 0 to 0. This visualization has the following annotation: Russia Invades Ukraine -->