0
2
4
6
8
10
0
10
20
30
40
50
60
Range
plotly-logomark
Edit chart
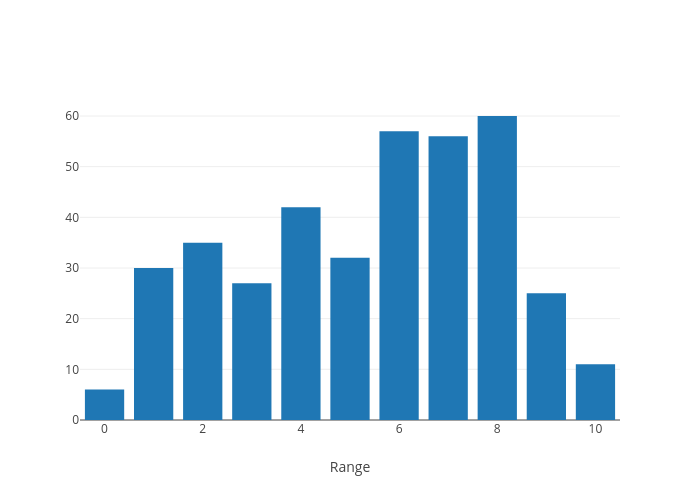
Mhaeussermann's interactive graph and data is a histogram; with Range in the x-axis. The x-axis shows values from -0.5 to 10.5. The y-axis shows values from 0 to 63.1578947368421.