2008
2010
2012
2014
2016
2018
2020
0
2
4
6
8
10
plotly-logomark
Edit chart
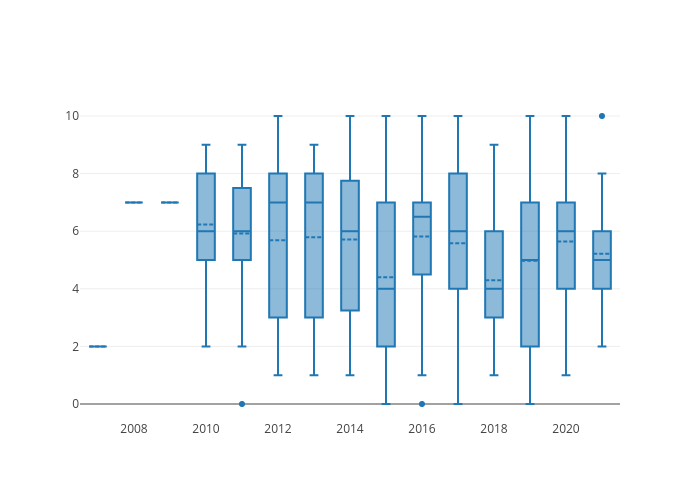
Mhaeussermann's interactive graph and data is a box plot. The x-axis shows values from 2006.5 to 2021.5. The y-axis shows values from -0.5555555555555556 to 10.555555555555555.