20.12.1990
14.05.1991
16.10.1991
23.01.1992
17.06.1992
13.11.1992
10.03.1993
02.07.1993
25.11.1993
11.03.1994
06.09.1994
08.03.1995
29.06.1995
23.11.1995
14.03.1996
29.08.1996
29.11.1996
21.03.1997
24.09.1997
04.02.1998
29.05.1998
20.01.1999
06.05.1999
29.10.1999
18.02.2000
30.06.2000
29.11.2000
29.03.2001
11.09.2001
14.12.2001
25.04.2002
29.10.2002
20.12.2003
25.06.2003
14.11.2003
25.03.2004
22.09.2004
17.12.2004
22.04.2005
18.01.2006
10.05.2006
20.10.2006
01.03.2007
22.06.2007
29.11.2007
10.04.2008
24.09.2008
29.01.2009
17.06.2009
22.01.2010
07.05.2010
08.10.2010
10.02.2011
09.06.2011
09.11.2011
01.03.2012
28.06.2012
29.11.2012
19.04.2013
19.12.2013
10.04.2014
25.09.2014
14.01.2015
06.05.2015
30.09.2015
15.01.2016
03.06.2016
09.11.2016
10.03.2017
12
13
14
15
16
17
18
0
200
400
600
800
1000
1200
1400
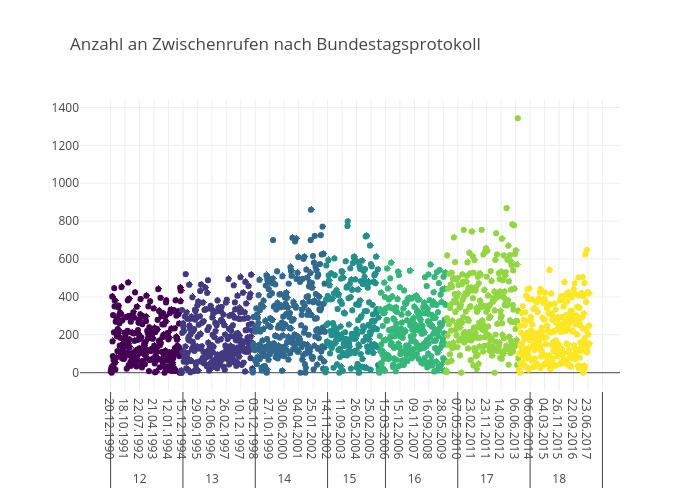
Anzahl an Zwischenrufen nach Bundestagsprotokoll
plotly-logomark
Edit chart
Mhaeussermann's interactive graph and data of "Anzahl an Zwischenrufen nach Bundestagsprotokoll" is a scatter chart, showing Zwischenrufe. The x-axis shows values from -103.65744535519127 to 1757.6574453551912. The y-axis shows values from -108.46370235934663 to 1451.4637023593466.