marital_status
education_num
occupation
age
hours_per_week
workclass
random
fnlwgt
sex
race
0
0.005
0.01
0.015
0.02
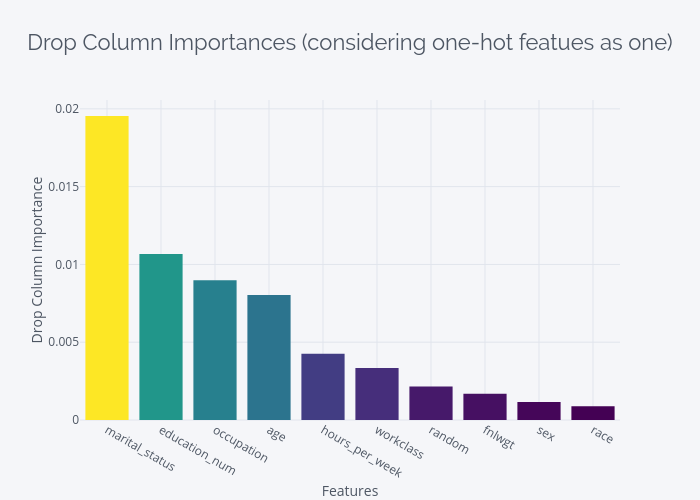
Drop Column Importances (considering one-hot featues as one)
Features
Drop Column Importance
plotly-logomark
Edit chart
Manujosephv's interactive graph and data of "Drop Column Importances (considering one-hot featues as one)" is a bar chart, showing drop_col_importance; with Features in the x-axis and Drop Column Importance in the y-axis.. The x-axis shows values from -0.5 to 9.5. The y-axis shows values from 0 to 0.02056857074013109.