0
100
200
300
400
500
600
700
2
3
2
3
Days since the last release
Version
plotly-logomark
Edit chart
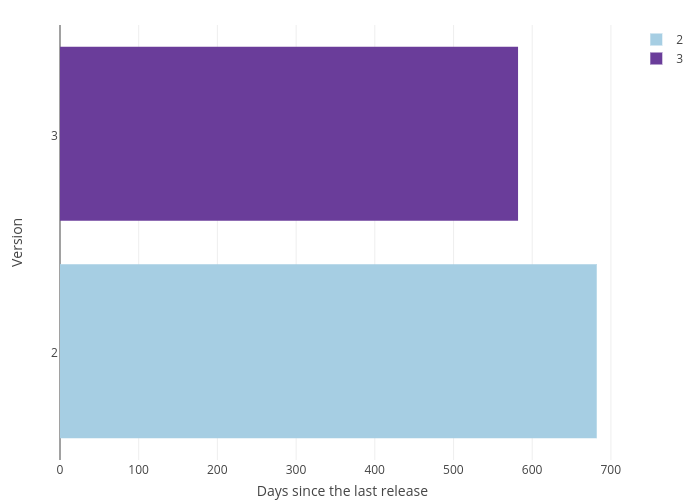
M.ziembinski's interactive graph and data of "Version vs Days since the last release" is a bar chart, showing 2 vs 3; with Days since the last release in the x-axis and Version in the y-axis.. The x-axis shows values from 0 to 0. The y-axis shows values from 0 to 0.