Jul 2015
Sep 2015
Nov 2015
Jan 2016
Mar 2016
May 2016
Jul 2016
Sep 2016
0.2.0
0.2.2
0.3.1
0.5.0
0.6.0
0.6.2
0.8.0
0.9.0
0.10.1
0.11.1
1.0.0
2.0.0
3.0.1
3.0.3
3.0.5
3.1.0
3.1.2
3.1.4
3.1.6
3.2.0
3.3.0
3.4.0
3.5.1
3.6.0
0
1
2
3
Date of the release
Version
plotly-logomark
Edit chart
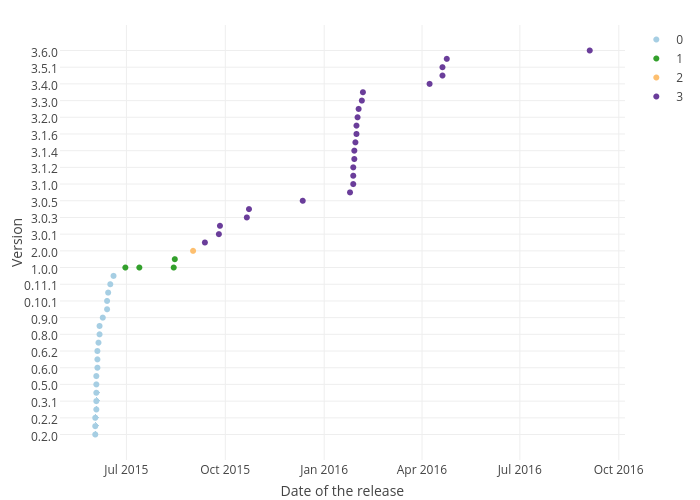
M.ziembinski's interactive graph and data of "Version vs Date of the release" is a scatter chart, showing 0, 1, 2, 3; with Date of the release in the x-axis and Version in the y-axis.. The x-axis shows values from 0 to 0. The y-axis shows values from 0 to 0.