2009
2010
2011
2012
2013
2014
2015
2016
2017
0.0.1
0.1.4
0.1.14
0.1.24
0.1.90
0.1.100
0.2.5
0.3.8
0.4.9
0.5.6
0.6.5
0.6.15
0.7.3
0.8.0
0.8.10
0.8.20
0.9.1
0.9.11
0.10.8
0.10.18
0.10.28
0.10.38
0.10.48
0.11.9
0.12.2
0.12.12
1.0.3
1.6.0
1.8.4
2.3.3
4.1.0
4.3.0
4.4.7
4.8.1
5.5.0
5.11.0
6.4.0
6.9.4
7.2.1
7.8.0
0
1
2
3
4
5
6
7
8
Date of the release
Version
plotly-logomark
Edit chart
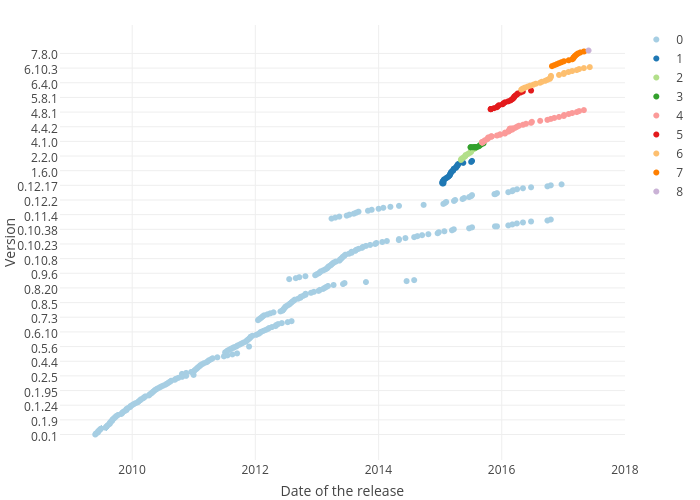
M.ziembinski's interactive graph and data of "Version vs Date of the release" is a scatter chart, showing 0, 1, 2, 3, 4, 5, 6, 7, 8; with Date of the release in the x-axis and Version in the y-axis.. The x-axis shows values from 0 to 0. The y-axis shows values from 0 to 0.