Belgium
Australia
Iceland
Netherlands
Mexico
Austria
Rep Korea
Sweden
Norway
Finland
Hungary
NZ
United Kingdom
Canada
Spain
Argentina
Turkey
Poland
Switzerland
Portugal
Brazil
US (mandated states)
Germany
France
Ireland
Japan
Italy
Czech Rep.
US (non-mandated states)
0
10
20
30
40
50
0
1000
2000
3000
4000
5000
6000
ART Affordability (%)
Utilization
plotly-logomark
Edit chart
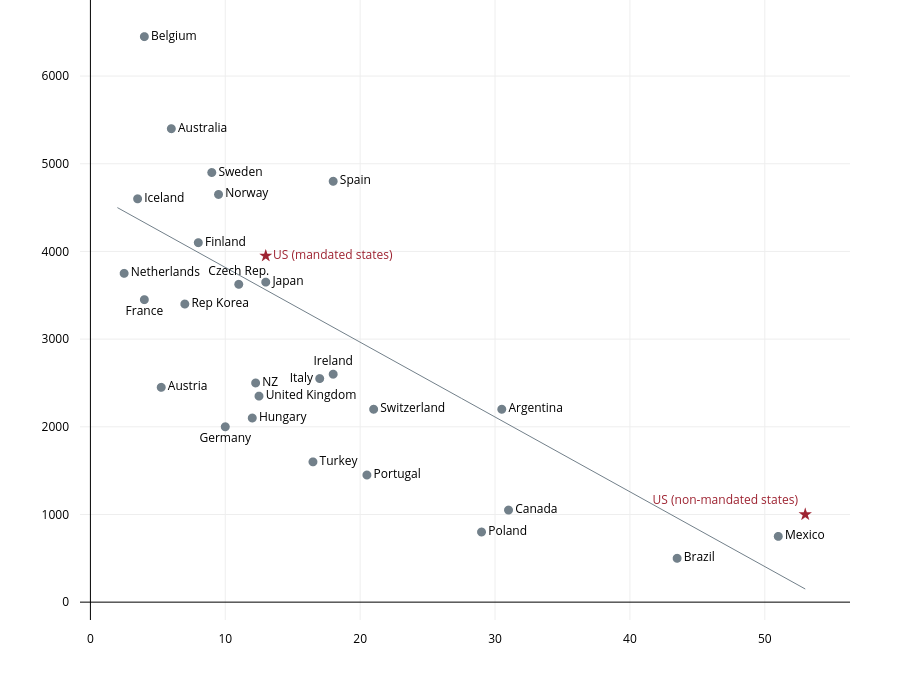
Lmnostudio's interactive graph and data of "" is a , showing All Other Countries, US Mandated, Trend Line, All Other Countries 2, Ireland, Japan, Ireland, Czech Rep, US Non-Mandated; with ART Affordability (%) in the x-axis and Utilization in the y-axis.. The x-axis shows values from -0.7715177096714991 to 56.317856487428884. The y-axis shows values from -203.5641547861507 to 6867.718940936864.