0
10
20
30
40
50
Geometry I/II
Mathematical Investigations I/II
Mathematical Investigations II
Mathematical Investigations III
Mathematical Investigations IV
BC Calculus (I, II, or III)
Beyond BC Calculus
Female
Male
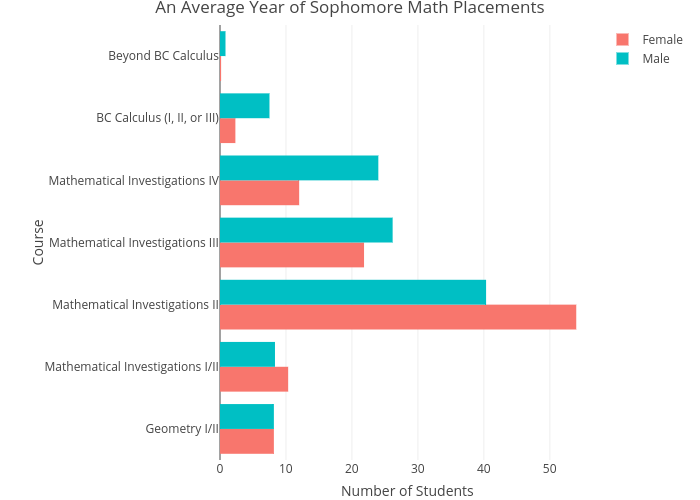
An Average Year of Sophomore Math Placements
Number of Students
Course
plotly-logomark
Edit chart
Lliu12's interactive graph and data of "An Average Year of Sophomore Math Placements" is a grouped bar chart, showing Female vs Male; with Number of Students in the x-axis and Course in the y-axis.. The x-axis shows values from 0 to 0. The y-axis shows values from 0 to 0.