20k
25k
30k
35k
40k
45k
50k
55k
60k
65k
−10
0
10
20
30
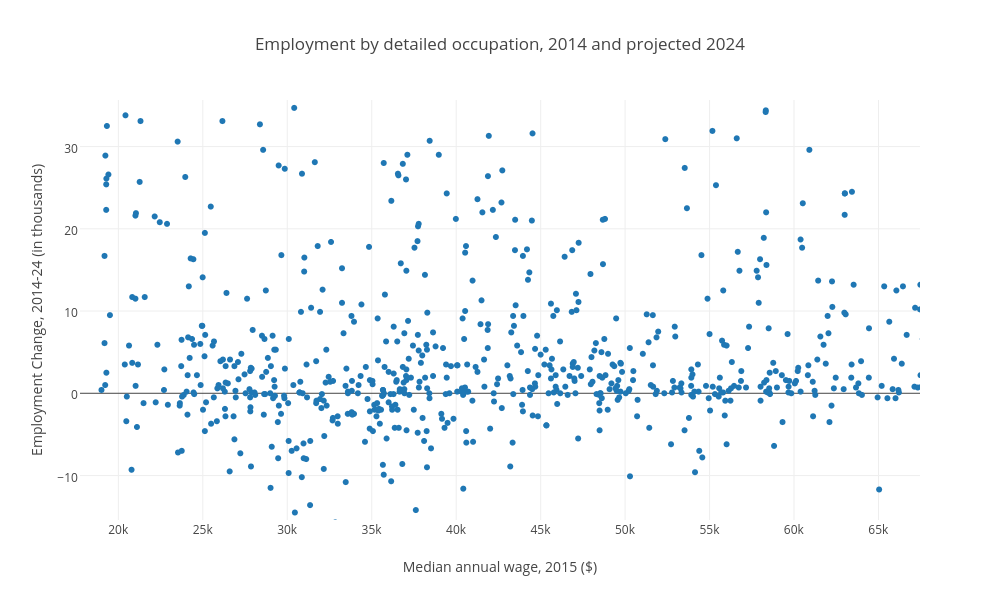
Employment by detailed occupation, 2014 and projected 2024
Median annual wage, 2015 ($)
Employment Change, 2014-24 (in thousands)
plotly-logomark
Edit chart
Libbyfalck's interactive graph and data of "Employment by detailed occupation, 2014 and projected 2024" is a scatter chart, showing F; with Median annual wage, 2015 ($) in the x-axis and Employment Change, 2014-24 (in thousands) in the y-axis.. The x-axis shows values from 17728.04320130547 to 67459.57099300018. The y-axis shows values from -15.409448160535122 to 35.659949832775915.